Overview
Welcome to Part 1 of a series of posts on Windows Exploit Development. In this first installment I’ll cover just the basics necessary to understand the content of future posts, including some Assembly syntax, Windows memory layout, and using a debugger. This will not be a comprehensive discussion on any of these topics so if you have no exposure to Assembly or if anything is unclear after you read through this first post I encourage you to take a look at the various links to resources I’ve provided throughout.
My plan for the rest of the series is to walk through various exploit topics, from the simple (direct EIP overwrite) to the more complicated (unicode, egg hunters, ASLR bypass, heap spraying, device driver exploits etc), using actual exploits to demonstrate each. I don’t really have an end in sight, so as I think of more topics, I’ll continue to write posts.
Purpose
My goal for this series of posts is to introduce the concepts of finding and writing Windows application exploits in the hope that Security and IT professionals that haven’t had much technical exposure to these concepts might take an interest in software security and apply their skills to make private and public domain software more secure. Disclaimer: If you’re someone that wants to build exploits to partake in illegal or immoral activity, please go elsewhere.
I should also mention that these posts are not intended to compete with other great tutorials out there such as Corelan Team, The Grey Corner, and Fuzzy Security. Instead, they are meant to complement them and provide yet another resource for explanations and examples — if you’re like me, you can never have too many examples. I highly encourage you to check out these other great sites.
What You’ll Need
Here’s what you’ll need if you want to follow along:
- A Windows installation: I plan to start with Windows XP SP3 but as I progress and cover different topics/exploits, I may also use other versions including Windows 7 and Windows Server 2003/2008.
- A Debugger: On the Windows host you’ll also need a debugger. I’ll primarily be using Immunity Debugger which you can download here. You should also get the mona plugin which can be found here. I’ll also use WinDbg for some of my examples. Instructions for download can be found here (scroll down the page for earlier versions of Windows).
- A Backtrack/Kali host (optional): I use a Kali host for all of my scripting and also plan to use it as the “attacking machine” in any remote exploit examples I use. I plan to use Perl and Python for the majority of my scripts so you may choose to install either language environment on your Windows host instead.
Getting Started with Immunity Debugger
Let’s begin by taking a look at a debugger since we’ll be spending quite a bit of time using one throughout these tutorials. I’m going to be primarily using Immunity debugger because it’s free and has some plugins and custom scripting capabilities that I plan on highlighting as we progress.
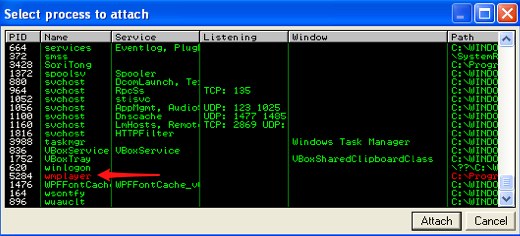
I’ll use Windows Media Player as an example program to introduce Immunity Debugger. If you want to follow along, open Windows Media Player and Immunity Debugger. In Immunity, click File –> Attach and select the name of the application/process (in my example, wmplayer). Note: you can also launch WMP directly from Immunity by clicking File –> Open and selecting the executable.
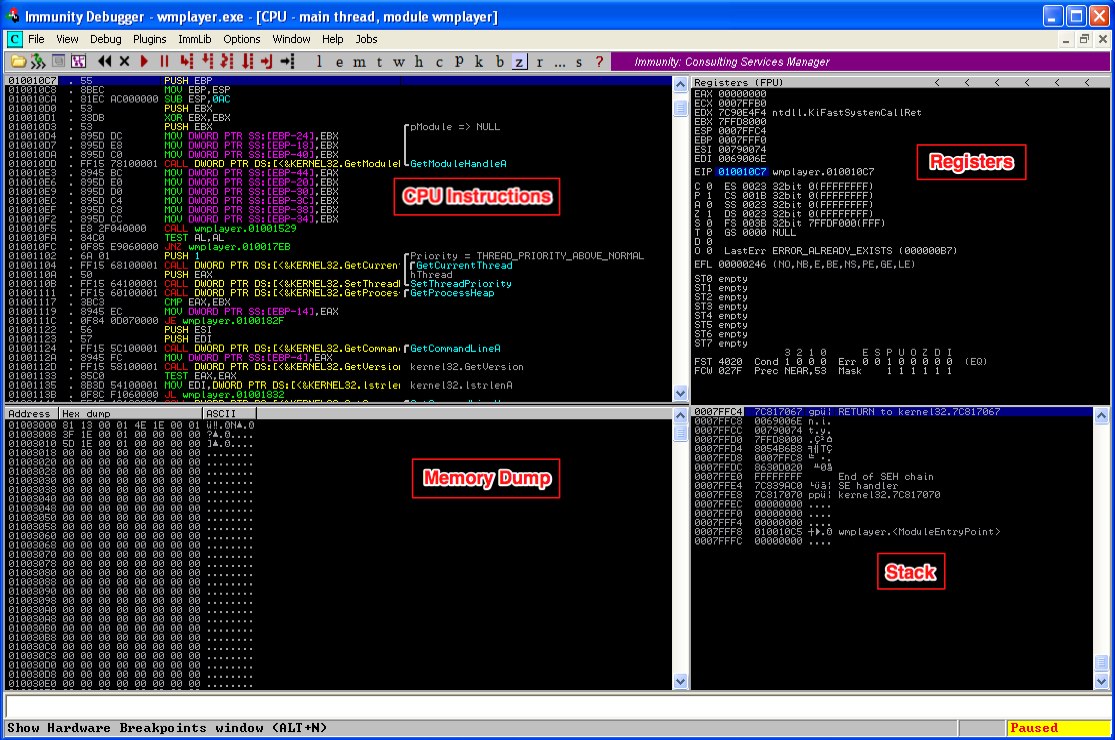
Once you’ve launched an executable or attached to a process within Immunity, you should be taken to the CPU view (if not, hit Alt+C), which looks like this:
When you run/attach to a program with Immunity it starts in a paused state (see lower right hand corner). To run the program you can hit F9 (or the play button in the toolbar). To step into the next instruction (but pause program execution) hit F7. You can use F7 to step through each instruction one at a time. If at any time you want to restart the program, hit Ctrl+F2. I won’t be providing a complete tutorial on how to use Immunity, but I will try to mention any relevant shortcuts and hotkeys as I present new concepts in this and future posts.
As you can see, the CPU window is broken up into four panes depicting the following information:
- The CPU Instructions – displays the memory address, opcode and assembly instructions, additional comments, function names and other information related to the CPU instructions
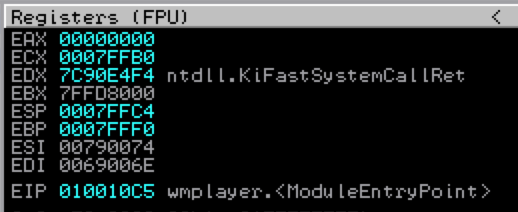
- The Registers – displays the contents of the general purpose registers, instruction pointer, and flags associated with the current state of the application..
- The Stack – shows the contents of the current stack
- The Memory Dump – shows the contents of the application’s memory
Let’s take a look at each one in a bit more depth, starting with the registers.
CPU Registers
The CPU registers serve as small storage areas used to access data quickly. In the x86 (32-bit) architecture there are 8 general-purpose registers: EAX, EBX, ECX, EDX, EDI, ESI, EBP, and ESP. They can technically be used to store any data, though they were originally architected to perform specific tasks, and in many cases are still used that way today.
Here’s a bit more detail for each…
EAX – The Accumulator Register.
It’s called the accumulator register because it’s the primary register used for common calculations (such as ADD and SUB). While other registers can be used for calculations, EAX has been given preferential status by assigning it more efficient, one-byte opcodes. Such efficiency can be important when it comes to writing exploit shellcode for a limited available buffer space (more on that in future tutorials!). In addition to its use in calculations, EAX is also used to store the return value of a function.
This general purpose register can be referenced in whole or in part as follows: EAX refers to the 32-bit register in its entirety. AX refers to the least significant 16 bits which can be further broken down into AH (the 8 most significant bits of AX) and AL (the 8 least significant bits).
Here’s a basic visual representation:
This same whole/partial 32-, 16-, and 8-bit referencing also applies to the next three registers (EBX, ECX, and EDX)
EBX – The Base Register.
In 32-bit architecture, EBX doesn’t really have a special purpose so just think of it as a catch-all for available storage. Like EAX, it can be referenced in whole (EBX) or in part (BX, BH, BL).
ECX – The Counter Register.
As its name implies, the counter (or count) register is frequently used as a loop and function repetition counter, though it can also be used to store any data. Like EAX, it can be referenced in whole (ECX) or in part (CX, CH, CL).
EDX – The Data Register
EDX is kind of like a partner register to EAX. It’s often used in mathematical operations like division and multiplication to deal with overflow where the most significant bits would be stored in EDX and the least significant in EAX. It is also commonly used for storing function variables. Like EAX, it can be referenced in whole (EDX) or in part (DX, DH, DL).
ESI – The Source Index
The counterpart to EDI, ESI is often used to store the pointer to a read location. For example, if a function is designed to read a string, ESI would hold the pointer to the location of that string.
EDI – The Destination Index
Though it can be (and is) used for general data storage, EDI was primarily designed to store the storage pointers of functions, such as the write address of a string operation.
EBP – The Base Pointer
EBP is used to keep track of the base/bottom of the stack. It is often used to reference variables located on the stack by using an offset to the current value of EBP, though if parameters are only referenced by register, you may choose to use EBP for general use purposes.
ESP – The Stack Pointer
ESP is used to track the top of the stack. As items are moved to and from the stack ESP increments/decrements accordingly. Of all of the general purpose registers, ESP is rarely/never used for anything other than it’s intended purpose.
The Instruction Pointer (EIP)
Not a general purpose register, but fitting to cover here, EIP points to the memory address of the next instruction to be executed by the CPU. As you’ll see in the coming tutorials, control the value of EIP and you can control the execution flow of the application (to execute code of your choosing).
Segment Registers and EFLAGS register
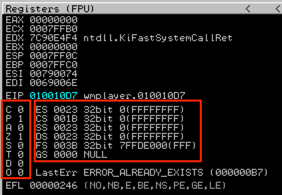
There are two additional registers you’ll see in the Register pane, the Segment Register and EFLAGS register. I won’t cover either in detail but note that the EFLAGS register is comprised of a series of flags that represent Boolean values resulting from calculations and comparisons and can be used to determine when/if to take conditional jumps (more on these later).
For more on the CPU registers, check out these resources:
Memory Dump
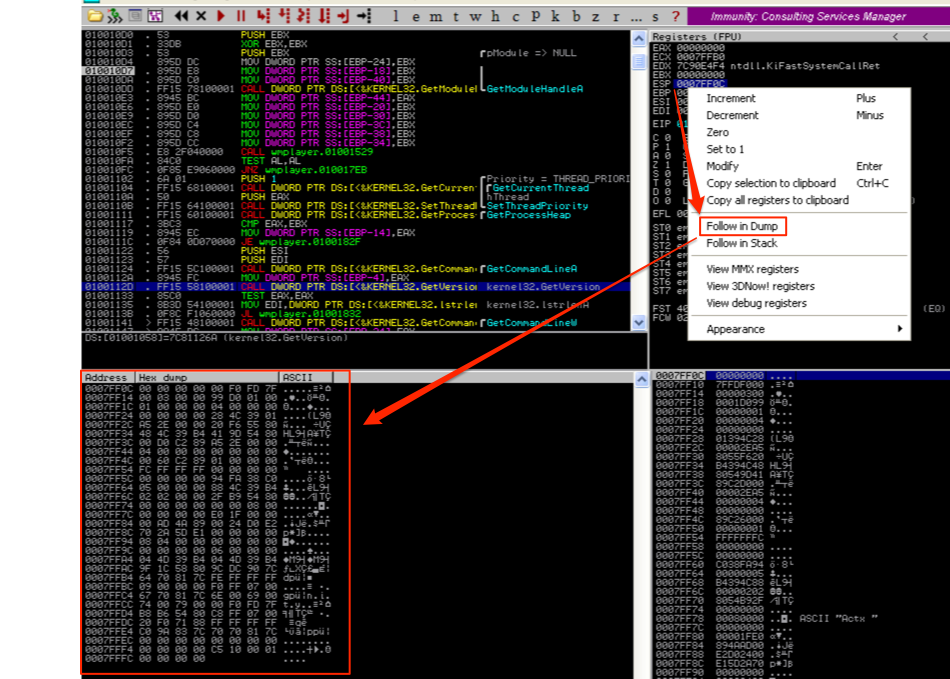
Skipping to the Memory Dump pane of the CPU view, this is simply where you can view the contents of a memory location. For example, let’s say you wanted to view the contents of memory at ESP, which in the following screenshot is pointing to 0007FF0C. Right-click on ESP, select “Follow in Dump” and the Memory Dump pane will display that location.
CPU Instructions
As you are probably aware, most applications today are written in a high-level language (C, C++, etc). When the application is compiled, these high-level language instructions are translated into Assembly which has corresponding opcode to help further translate the instruction into something the machine can understand (machine code). Within the debugger, you can view each Assembly instruction (and corresponding opcode) being processed by the CPU within the CPU Instruction Pane. Note: For the Windows Exploit Series, I’ll be using the x86 assembly language Intel syntax (http://en.wikipedia.org/wiki/X86_assembly_language#Syntax).
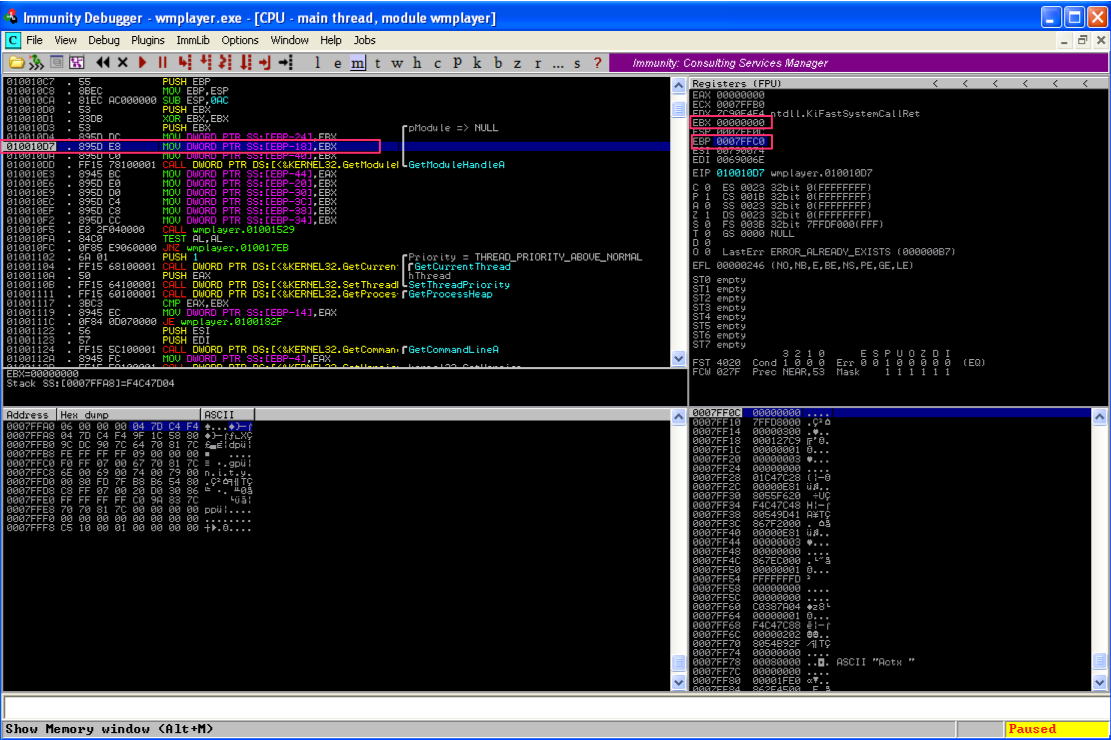
You can step through the execution flow of the program one at a time (F7) and see the result of each CPU instruction. Let’s take a look at the first set of instructions for Windows Media Player. The program starts paused. Hit F7 a few times to execute the first few instructions until we get to the second MOV DWORD PTR SS: instruction (highlighted in the below screenshot). The MOV instruction copies a data item from one location to another.
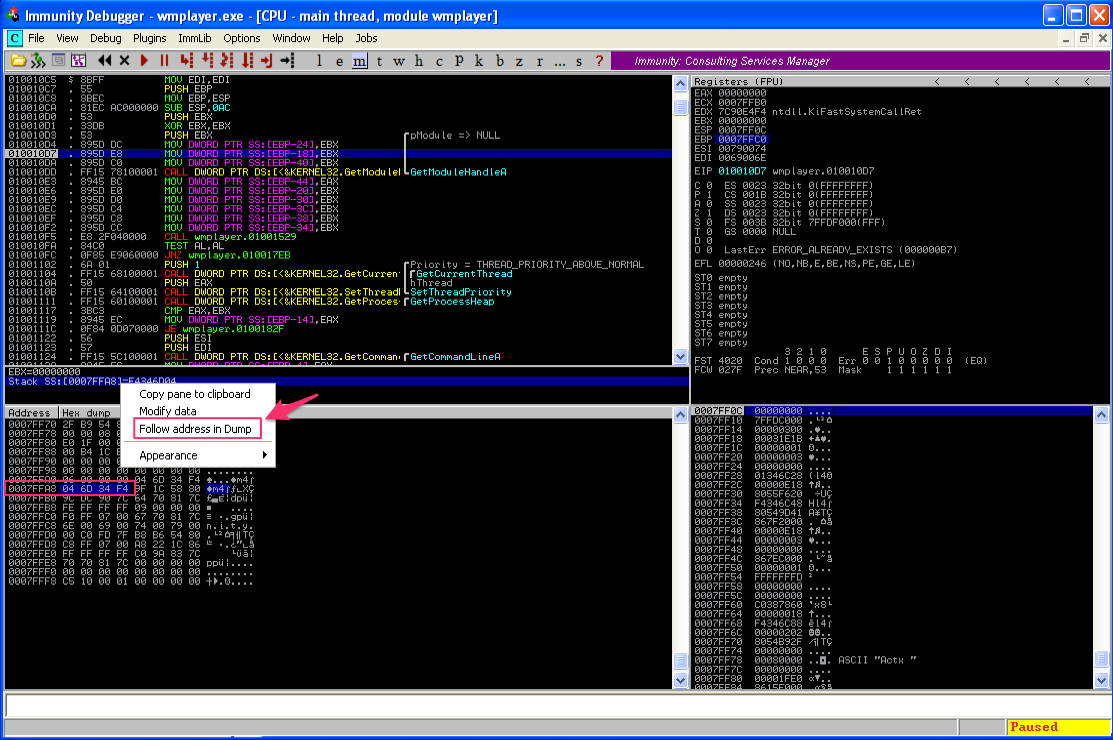
This instruction is going to move the contents of EBX into the memory address location pointed to by EBP – 18 (remember with x86 Intel syntax it’s MOV [dst] [src]). Notice that EBP (the stack base pointer) is pointing to 0007FFC0. Using your Windows or Mac calculator (in scientific/programmer mode), calculate 0007FFC0 – 0x18. The result should be 0x7FFA8, meaning that the contents of EBP will be placed into the location of address 0007FFA8. In fact, you don’t have to calculate this outside of Immunity. Notice the sub-window at the bottom of the CPU instruction pane. It already tells you the value of EBX, as well as the value of 0007FFC0 – 0x18 and the current contents of that memory location (F4C47D04). You can right-click on the “Stack” line in that sub-window and select “Follow address in Dump” to verify the contents of that memory location.
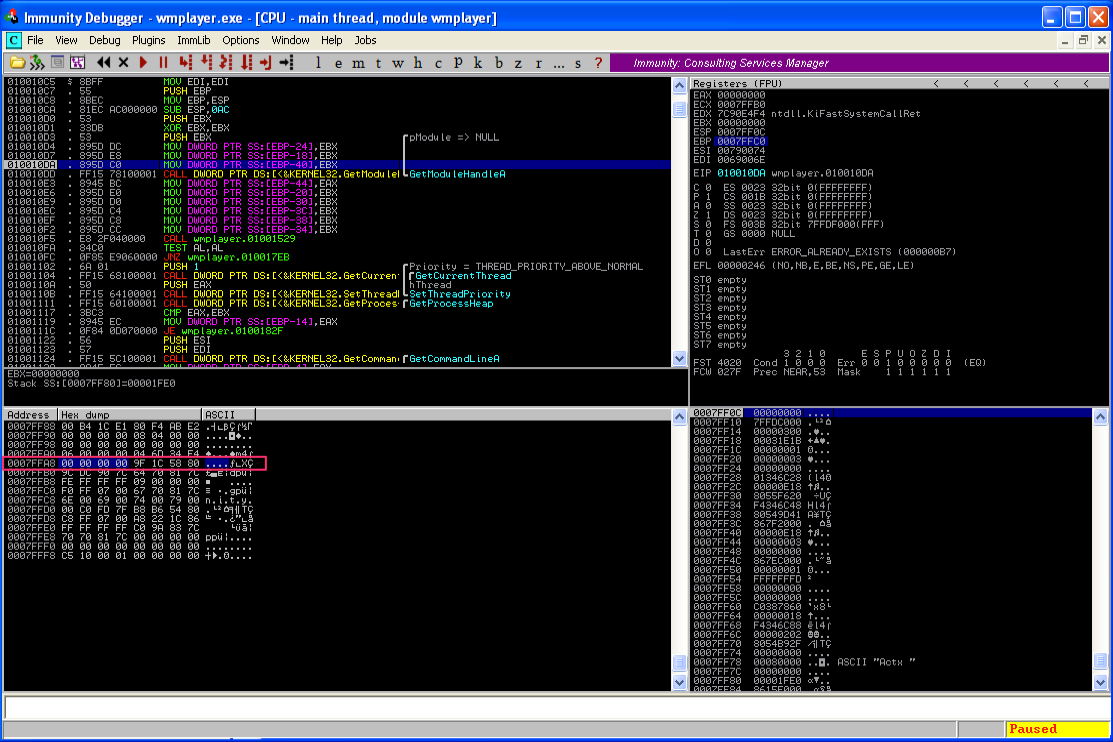
Now hit F7 again to execute the instruction. Notice how the memory location 0007FFA8 now has a value of 00000000, since the contents of EBX were moved there.
This was just a quick example of how you can follow the execution of each CPU instruction within Immunity. Here’s a few more common Assembly instructions and syntax you’ll come across:
- ADD/SUB op1, op2 — add or subtract two operands, storing the result in the first operand. These can be registers, memory locations (limit of one) or constants. For example, ADD EAX, 10 means add 10 to the value of EAX and store the result in EAX
- XOR EAX, EAX — Performing an ‘exclusive or’ of a register with itself sets its value to zero; an easy way of clearing the contents of a register
- INC/DEC op1– increment or decrement the value of the operand by one
- CMP op1, op2 — compare the value of two operands (register/memory address/constant) and set the appropriate EFLAGS value.
- Jump (JMP) and conditional jump (je, jz, etc) — as the name implies these instructions allow you to jump to another location in the execution flow/instruction set. The JMP instruction simply jumps to a location whereas the conditional jumps (je, jz, etc) are taken only if certain criteria are met (using the EFLAGS register values mentioned earlier). For example, you might compare the values of two registers and jump to a location if they are both equal (uses je instruction and zero flag (zf) = 1).
- When you see a value in brackets such as ADD DWORD PTR [X] or MOV eax, [ebx] it is referring to the value stored at memory address X. In other words, EBX refers to the contents of EBX whereas [EBX] refers to the value stored at the memory address in EBX.
- Relevant size keywords: BYTE = 1 byte, WORD = 2 bytes, DWORD = 4 bytes.
I’m certainly no expert, but when it comes to understanding and eventually developing your own exploit code, you should to have a pretty solid grasp of Assembly. I’ll be discussing a few more Assembly instructions as we progress but I don’t plan on covering the Assembly language in-depth, so if you need a refresher there are a ton of good online resources including:
- x86 Assembly Guide
- Sandpile.org
- The Art of Assembly Language Programming
- Windows Assembly Language Megaprimer
If you want a book to purchase, you might consider this one: Hacking: The Art of Exploitation: The Art of Exploitation which not only covers the basics of Assembly but also gets into writing exploits (though primarily in a Linux environment).
For this series of posts I will do my best to explain any code examples I use so if you have at least some basic understanding of Assembly you should be fine.
Windows Memory Layout
Before we talk about the stack, I want to talk briefly about the Win32 process memory layout. I should state up-front that this will be an extremely high-level introduction and will not cover concepts such as Address Space Layout Randomization (ASLR), Virtual to Physical Address translation, Paging, Physical Address Extension, etc. I plan to cover some of these topics in a later installment, but for now I want to keep things very simple.
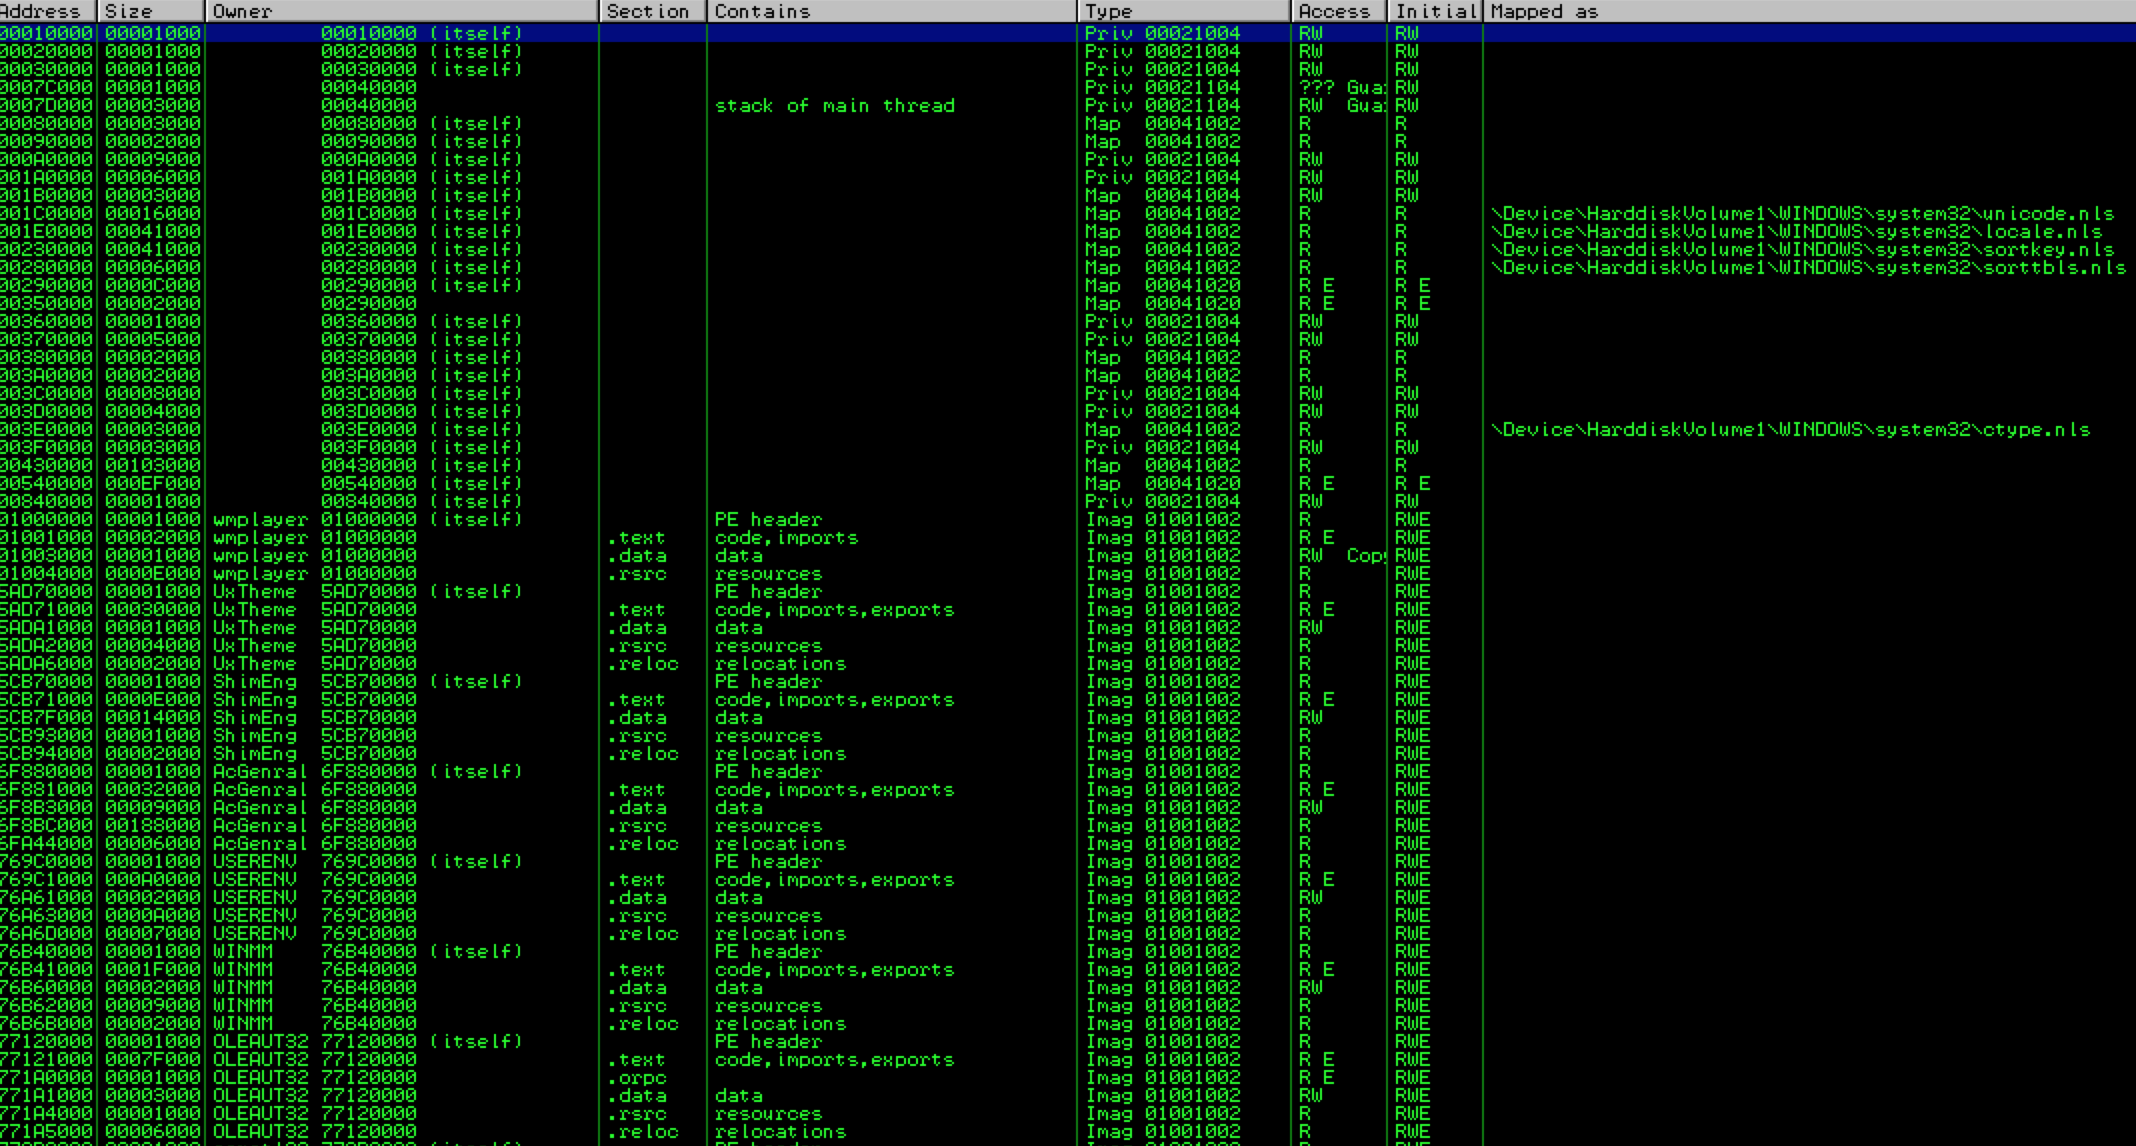
First, with Immunity attached to Windows Media Player, take a look at the memory map by hitting ALT+M (Alternatively you can select View->Memory or click the ‘M’ icon on the toolbar).
You should be presented with something that looks like the following (exact entries may vary):
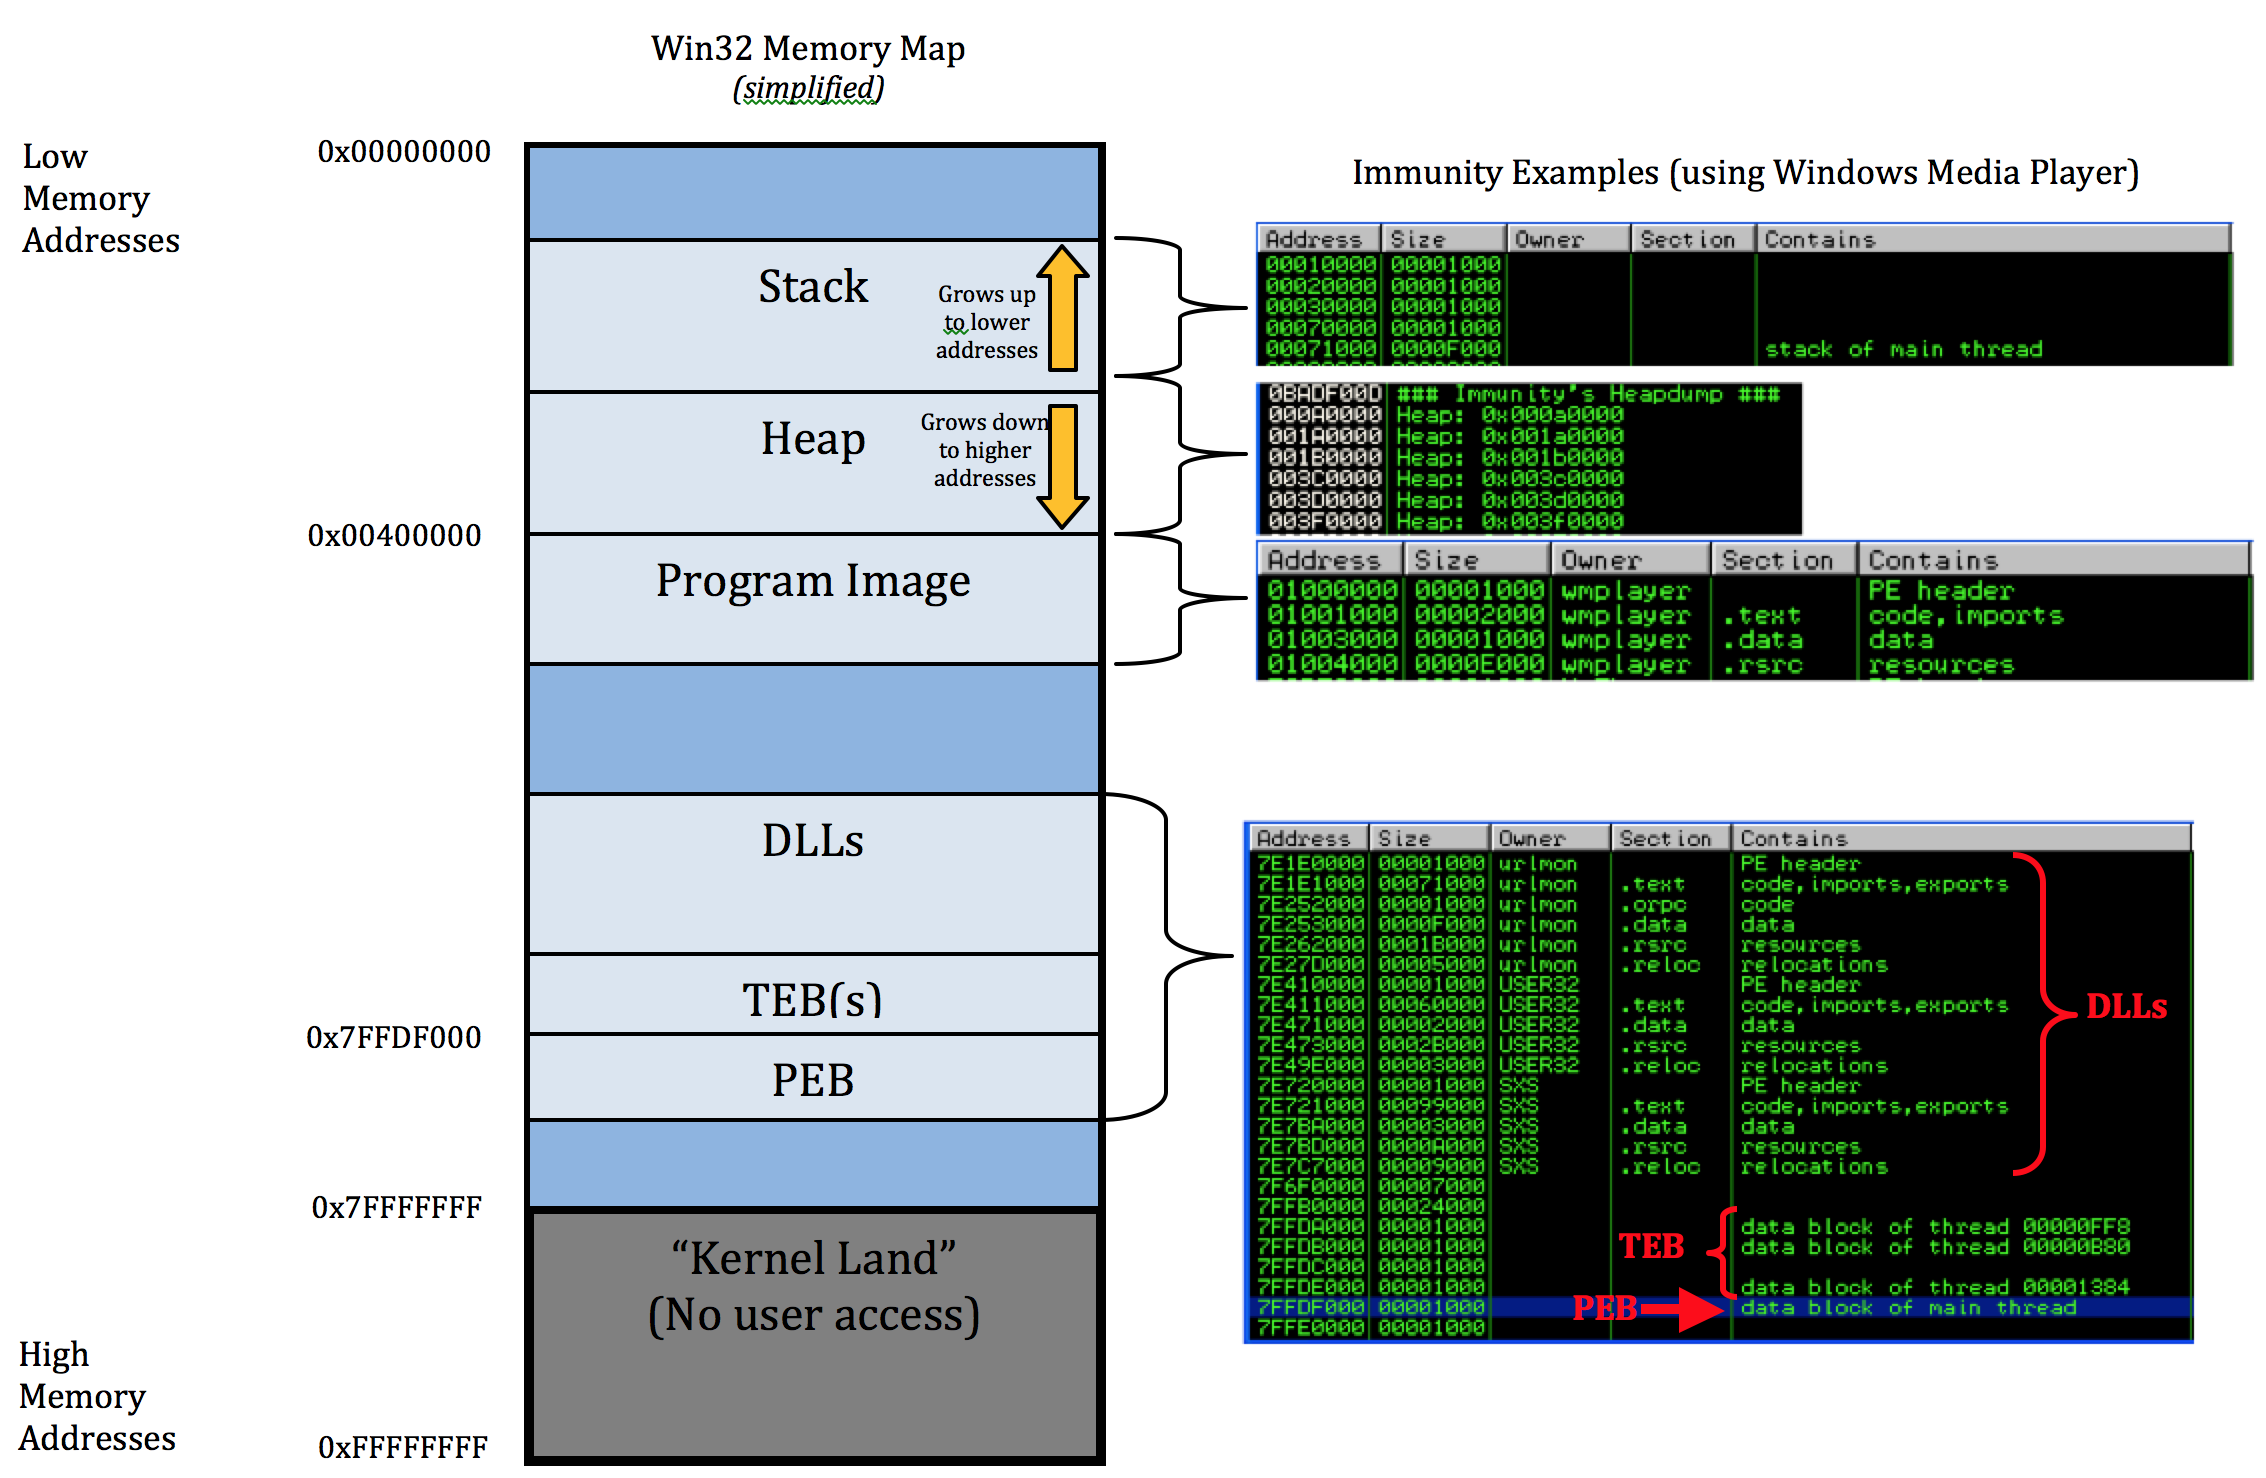
This is the memory layout of the wmplayer.exe including the stack, heap, loaded modules (DLLs) and the executable itself. I’ll introduce each of these items in a bit more detail using a slightly simplified version of the memory map found on Corelan’s great introductory tutorial on Stack Based Overflows which I’ve mapped to the Immunity memory map of Windows Media Player.
Let’s work our way up from the bottom, starting with the portion of memory from 0xFFFFFFFF to 0x7FFFFFFF which is often referred to as “Kernel Land”.
Kernel Land
This portion of memory is reserved by the OS for device drivers, system cache, paged/non-paged pool, HAL, etc. There is no user access to this portion of memory. Note: for a thorough explanation of Windows memory management you should check out the Windows Internals books (currently two volumes).
PEB and TEB(s)
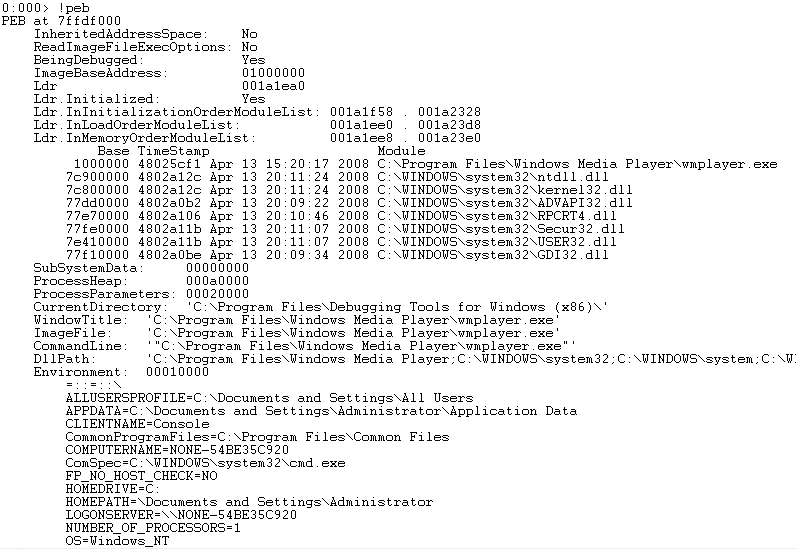
When you run a program/application, an instance of that executable known as a process is run. Each process provides the resources necessary to run an instance of that program. Every Windows process has an executive process (EPROCESS) structure that contains process attributes and pointers to related data structures. While most of these EPROCESS structures reside in Kernel Land, the Process Environment Block (PEB) resides in user-accessible memory. The PEB contains various user-mode parameters about a running process. You can use WinDbg to easily examine the contents of the PEB by issuing the !peb command.
As you can see, the PEB includes information such as the base address of the image (executable), the location of the heap, the loaded modules (DLLs), and Environment variables (Operating system, relevant paths, etc). Take a look at the ImageBaseAddress from the above WinDbg screenshot. Note the address 01000000. Now refer back to the previous Win32 Memory Map diagram and note how this is the same as the very first address in the Immunity callout of the “Program Image” block. You can do the same for the heap address and associated DLLs.
A quick note about symbol files…it’s especially helpful to load the appropriate symbol files when debugging Windows applications as they provide useful, descriptive information for functions, variables, etc. You can do so within WinDbg by navigating to “File –> Symbol File Path…”. Follow the instructions found here: http://support.microsoft.com/kb/311503. You can also load symbol files in Immunity by navigating to “Debug –> Debugging Symbol Options”.
More details on the entirety of the PEB structure can be found here.
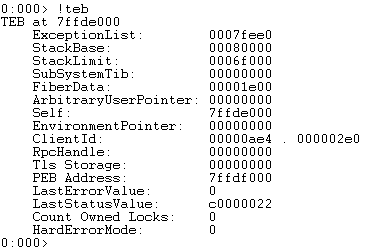
A program, or process, can have one or more threads which serve as the basic unit to which the operating system allocates processor time. Each process begins with a single thread (primary thread) but can create additional threads as needed. All of the threads share the same virtual address space and system resources allocated to the parent process. Each thread also has its own resources including exception handlers, priorities, local storage, etc. Just like each program/process has a PEB, each thread has a Thread Environment Block (TEB). The TEB stores context information for the image loader and various Windows DLLs, as well as the location for the exception handler list (which we’ll cover in detail in a later post). Like the PEB, the TEB resides in the process address space since user-mode components require writable access.
You can also view the TEB(s) using WinDbg.
More details on the entirety of the TEB structure can be found here and more details on processes and threads can be found here.
DLLs
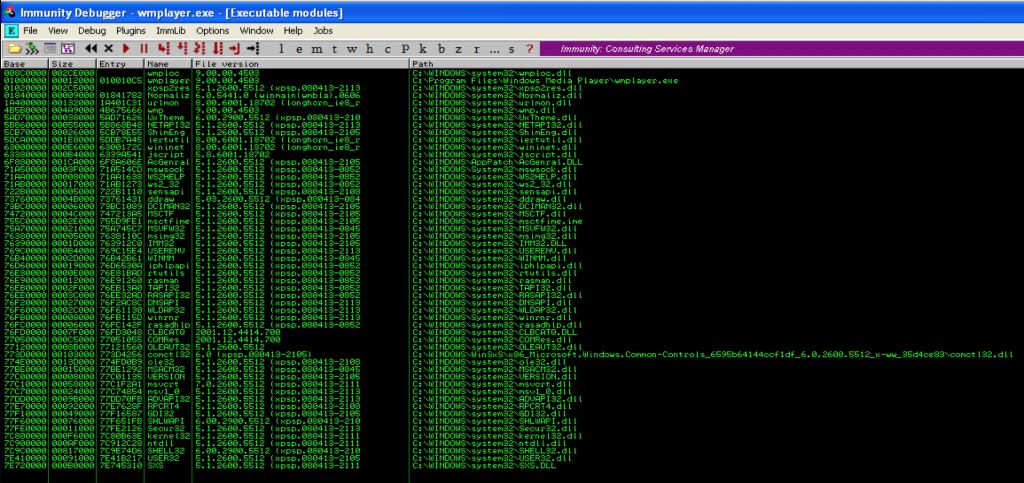
Windows programs take advantage of shared code libraries called Dynamic Link Libraries (DLLs) which allows for efficient code reuse and memory allocation. These DLLs (also known as modules or executable modules) occupy a portion of the memory space. As shown in the Memory Map screenshot, you can view them in Immunity in the Memory view (Alt+M) or if you want to only view the DLLs you can select the Executable Module view (Alt+E). There are OS/system modules (ntdll, user32, etc) as well as application-specific modules and the latter are often useful in crafting overflow exploits (covered in future posts).
Here’s a screenshot of the Memory view in Immunity:
Program Image
The Program Image portion of memory is where the executable resides. This includes the .text section (containing the executable code/CPU instructions) the .data section (containing the program’s global data) and the .rsrc section (contains non-executable resources, including icons, images, and strings).
Heap
The heap is the dynamically allocated (e.g. malloc( )) portion of memory a program uses to store global variables. Unlike the stack, heap memory allocation must be managed by the application. In other words, that memory will remain allocated until it is freed by the program or the program itself terminates. You can think of the heap as a shared pool of memory whereas the stack, which we’ll cover next, is more organized and compartmentalized. I won’t go too much deeper to the heap just yet but plan to cover it in a later post on heap overflows.
The Stack
Unlike the heap, where memory allocation for global variables is relative arbitrary and persistent, the stack is used to allocate short-term storage for local (function/method) variables in an ordered manner and that memory is subsequently freed at the termination of the given function. Recall how a given process can have multiple threads. Each thread/function is allocated its own stack frame. The size of that stack frame is fixed after creation and the stack frame is deleted at the conclusion of the function.
PUSH and POP
Before we look at how a function is assigned a stack frame, let’s take a quick look at some simple PUSH and POP instructions so you can see how data is placed onto and taken off of the stack. The stack is a last-in first-out (LIFO) structure meaning the last item you put on the stack is the first item you take off. You “push” items onto the top of the stack and you “pop” items off of the top of the stack. Let’s take a look at this in action…
In the following screenshot, you’ll see a series of PUSH instructions in the CPU instructions pane (top left), each of which will take a value from one of the registers (top right pane) and put that value on top of the stack (lower right pane).
Let’s start with the first PUSH instruction (PUSH ECX).
Take note of the value of ECX as well as the address and value of the top of the stack (lower right hand corner of the previous screenshot). Now the PUSH ECX instruction executes…
After the first PUSH ECX instruction, the value from ECX (address 0012E6FC) was pushed to the top of the stack (as illustrated in the above screenshot). Notice how the address of the top of the stack decreased by 4 bytes (From 0012E650 to 0012E64C). This illustrates how the stack grows upward to lower addresses as items are pushed to it. Also notice that ESP points to the top of the stack and EBP points to the base of this stack frame. You’ll notice in the coming screenshots that EBP (the base pointer) remains constant while ESP (the stack pointer) shifts as the stack grows and shrinks. Now, the second PUSH ECX instruction will be executed…
Once again, the value from ECX (0012E6FC) was pushed to the top of the stack, ESP adjusted its value by another 4 bytes, and as you can see in the above screenshot, the last PUSH instruction (PUSH EDI) is about to be executed.
Now the value from EDI (41414139) was pushed to the top of the stack and the next instruction in the list is about to be executed (a MOV instruction) and the value of EDI changed. Let’s skip ahead to the POP EDI instruction to show how items are taken off of the stack. In this case, the current value on top of the stack (41414139) is going to be popped off and placed into EDI.
As you can see, the value of EDI has changed back to 41414139 following the POP instruction. Now that you have an idea of how the stack is manipulated, let’s take a look at how stack frames are created for functions and how local variables are placed on the stack. Understanding this will be critical as we move into stack-based overflows in part 2 of this series.
Stack Frames and Functions
When a program function executes, a stack frame is created to store its local variables. Each function gets its own stack frame, which is put on top of the current stack and causes the stack to grow upwards to lower addresses.
Each time a stack frame is created, a series of instructions executes to store function arguments and the return address (so the program knows where to go after the function is over), save the base pointer of the current stack frame, and reserve space for any local function variables. [note: I’m intentionally omitting exception handlers for this basic discussion but will address them in a later post].
Let’s take a look at the creation of a stack frame using one of the simplest functions I could find (from Wikipedia):
This code simply calls function foo( ), passing it a single command line argument parameter (argv[1]). Function foo( ) then declares a variable c of length 12, which reserves the necessary space on the stack to hold argv[1]. It then calls function strcpy( ) which copies the value of argv[1] into variable c. As the comment states, there is no bounds checking so this use of strcpy could lead to a buffer overflow, which I’ll demonstrate in the part 2 of this series. For now, let’s just focus on how this function affects the stack.
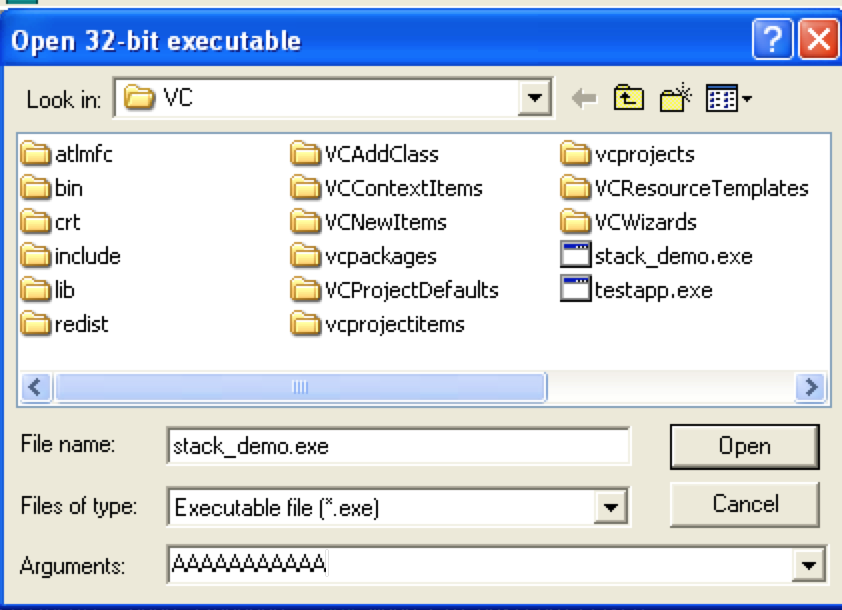
I compiled this c program (as stack_demo.exe) using Visual Studio Command Prompt (2010) to show exactly what it looks like as it executes in a debugger. You can run a program with command line arguments directly from Immunity by selecting File–>Open (or simply hitting F3), selecting your executable, and entering your command line argument(s) in the given field.
For this example, I simply used 11 A’s for argv[1]. [We’ll take a look at what happens when you use more than 11 in part 2!]
If you want to follow along, you’ll probably want to insert some breakpoints at the relevant portions of the code. Since addresses can change, the best method to find our relevant program code is to select View –> Executable modules (or Alt+E). Then, double-click the stack_demo.exe module (or whatever you named your .exe).
This should take you to the following:
The first line you see is actually the start of foo( ), but we’re going to first take a look at main( ). I’ve set several breakpoints to assist in walking through the code (indicated by the light blue highlight) and you can do the same by selecting the desired address and hitting F2. Let’s take a look at main( ) …
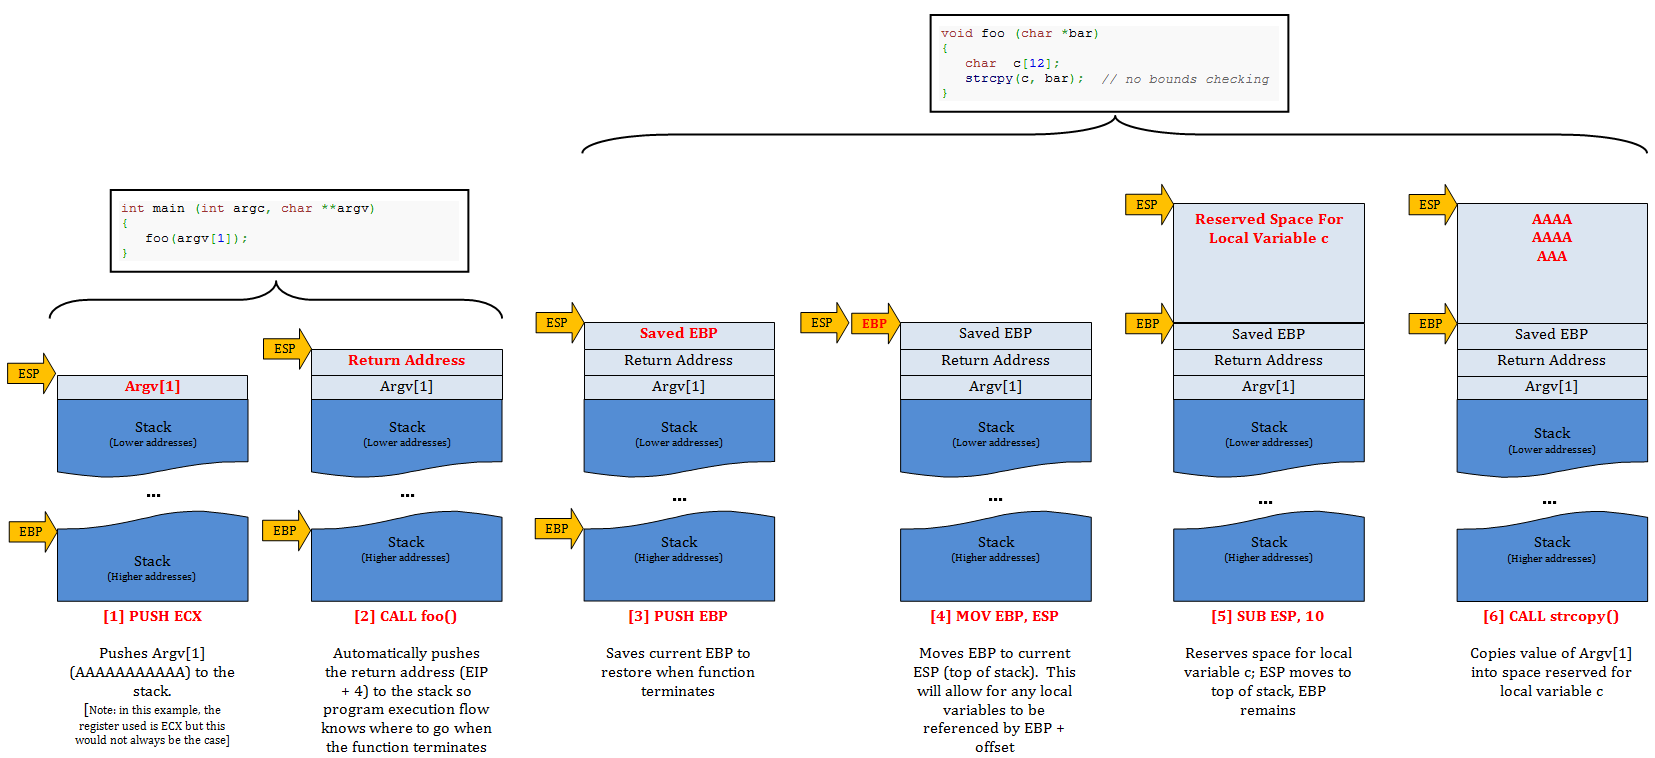
Although main( ) does nothing more than call function foo( ) there are a couple of things that have to happen first, as you’ll see within the debugger. First, it pushes the contents of Argv[1] (AAAAAAAAAAAAA) to the stack. Then, when function foo( ) is called, the return address is saved to the stack so the program execution flow can resume at the proper location after function foo( ) terminates.
Take a look at the Immunity screenshot, which I’ve commented accordingly — just pay attention to what’s in the red box for now; I’ll cover some of the other instructions shortly. You’ll see a pointer to argv[1] is pushed to the stack right before function foo( ) is called. Then the CALL instruction is executed and the return address to the next instruction (EIP + 4) is also pushed to the stack.
If you want proof that address 00332FD4 contains 0033301C which is a pointer to argv[1], refer to the dump contents of that address:
You’ll see the contents written backwards as 1C303300. Let me take this opportunity to quickly cover Little Endian notation. “Endianness” refers to the order in which bytes are stored in memory. Intel x86 based systems employ Little Endian notation which stores the least significant byte of a value at the smallest memory address (which is why the address is stored in reverse order). As an example, refer to the above hex dump screenshot — the address at the top (00332FD4) is the smallest and address at the bottom (00333034) is the largest. As such, the byte in the top left (currently occupied by 1C) occupies the smallest address location and the addresses get larger as you move left to right and top to bottom. When you look at an address such as 0033301C, the least significant byte is the byte all the way to the right (1C). To convert it to Little Endian notation you re-order it, one byte at a time, from right to left. Here’s a visual:
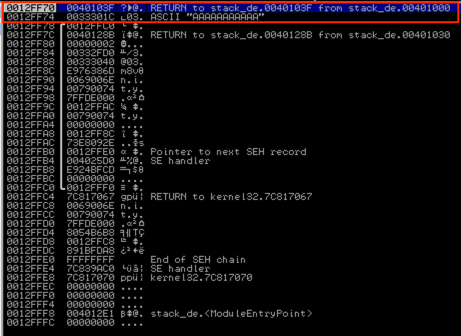
Ok, so argv[1] and the return address have now been pushed to the stack and function foo( ) has been called. Here’s a look at the stack with the relevant portions highlighted.
Note the pointer to argv[1] at address 0012FF74 and right above it the stored RETURN value. If you refer back to the previous screenshot of main( ), you’ll notice that the RETURN address of 0040103F is the next instruction after CALL foo( ), which is where the program execution will pick up after foo( ) terminates.
Now let’s look at function foo( ):
Once function foo( ) is called, the first thing that happens is the current base pointer (EBP) is saved to the stack via a PUSH EBP instruction so that once the function terminates, the base of the stack for main( ) can be restored.
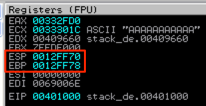
Next, EBP is set equal to ESP (via the instruction MOV EBP, ESP), making the top and bottom of the stack frame equal. From here, EBP will remain constant (for the life of function foo) and ESP will will grow up to a lower address as data is added to the function’s stack frame. Here’s a before and after view of the registers showing that EBP now equals ESP.
Next, space is reserved for the local variable c (char c[12]) via the following instruction: SUB ESP, 10.
Here’s a look at the stack after this series of instructions:
Notice how the top of the stack (and as a result ESP) has changed from 0012FF6C to 0012FF5C.
Let’s skip down to the call of strcpy( ), which will copy the contents of the argv[1] (AAAAAAAAAAAAA) into the space that was just reserved on the stack for variable c. Here’s a look at the function in the debugger. I’ve only highlighted the portion that performs the writing to the stack.
You’ll notice in the following screenshots that it continues to loop through the value of argv[1], writing to the reserved space on the stack (from top to bottom of the reserved space) until all of argv[1] has been written to the stack.
Before we take a look at what happens to the stack when a function terminates, here’s another step-by-step visual to reinforce the steps taken when function foo( ) is called.
After strcpy( ) has completed and function foo( ) is ready to terminate, some cleanup has to happen on the stack. Let’s take a look at the stack as foo( ) prepares to terminate and program execution is turned back over to main( ).
As you can see, the first instruction that is executed is MOV ESP, EBP which puts the value of EBP in ESP so it now points to 0012FF6C, and effectively removes variable c (AAAAAAAAAAA) from the stack. The top of the stack now contains saved EBP:
When the next instruction, POP EBP, is executed it will restore the previous stack base pointer from main( ) and increase ESP by 4. The stack pointer now points to the RETURN value placed on the stack right before foo( ) was called. When the RETN instruction is executed, it will take program execution flow back to the next instruction in main( ) just after the CALL foo( ) instruction, as illustrated in the below screenshot.
Function main( ) will perform its own cleanup by moving the stack pointer down the stack (by increasing its value by 4) and clearing the stack of argv[1]. It will then clear the register it used to store argv[1] (EAX) via an XOR, restore the saved EBP, and return to the saved return address.
That should be enough of a walk-though to understand how a function stack frame is created/deleted and how local variables are stored on the stack. If you want more examples, I encourage you to check out some of the other great tutorials out there (especially those published by Corelan Team).
Conclusion
That’s the end of this first installment in the Windows Exploits series. Hopefully, you’re now familiar with using a debugger, can recognize some basic Assembly instructions, and understand (at a high level) how Windows manages memory as well as how the stack operates. In the next post, we’ll pick up with the same basic function foo( ) to introduce the concept of stack-based overflows. Then I’ll jump right into writing a real-world example exploit found for an actual vulnerable software product.
I hope this first post was clear, accurate and useful. If you have any questions, comments, corrections, or suggestions for improvement, please don’t hesitate to leave me some feedback in the Comments section.
Related Posts:
- Windows Exploit Development – Part 1: The Basics
- Windows Exploit Development – Part 2: Intro to Stack Based Overflows
- Windows Exploit Development – Part 3: Changing Offset and Rebased Modules
- Windows Exploit Development – Part 4: Locating Shellcode with Jumps
- Windows Exploit Development – Part 5: Locating Shellcode with Egghunting
- Windows Exploit Development – Part 6: SEH Exploits
- Windows Exploit Development – Part 7: Unicode Buffer Overflows
 Security Sift





![dump of argv[1]](http://www.securitysift.com/wp-content/uploads/2013/12/dump_of_argv1.png)

